Friday, February 27, 2015

Definition of Parabola


pa·rab·o·la
pəˈrabələ/
noun
noun: parabola; plural noun: parabolae; plural noun: parabolas
  1. a symmetrical open plane curve formed by the intersection of a cone with a plane parallel to its side. The path of a projectile under the influence of gravity ideally follows a curve of this shape.

    Origin
    late 16th century: modern Latin, from Greek parabolē ‘placing side by side, application,’ from para- ‘beside’ + bolē ‘a throw’ (from the verb ballein ).

Graphing Quadratic Functions: The Leading Coefficient / The Vertex


Graphing Quadratic Functions: The
     Leading Coefficient / The Vertex


The general form of a quadratic is "y = ax2 + bxc". For graphing, the leading coefficient "a" indicates how "fat" or how "skinny" the parabola will be.
For | a | > 1 (such as a = 3 or a = –4), the parabola will be "skinny", because it grows more quickly (three times as fast or four times as fast, respectively, in the case of our sample values
of 
a).
For a | < 1 (such as a = 1/3 or a = –1/), the parabola will be "fat", because it grows more slowly (one-third as fast or one-fourth as fast, respectively, in the examples). Also, if a is negative, then the parabola is upside-down.

Watch how 'a' and the parabola move.
You can see these trends when you look at how the curve y = ax2 moves as "a" changes:


As you can see, as the leading coefficient goes from very negative to slightly negative to zero (not really a quadratic) to slightly positive to very positive, the parabola goes from skinny upside-down to fat upside-down to a straight line (called a "degenerate" parabola) to a fat right-side-up to a skinny right-side-up.   Copyright © Elizabeth Stapel 2002-2011 All Rights Reserved
There is a simple, if slightly "dumb", way to remember the difference between right-side-up parabolas and upside-down parabolas:


positive quadratic y = x2        negative quadratic y = –x2
I'm feeling positive!I'm feeling negative.
smily graphfrowny graph

This can be useful information: If, for instance, you have an equation where a is negative, but you're somehow coming up with plot points that make it look like the quadratic is right-side-up, then you will know that you need to go back and check your work, because something is wrong.


Parabolas always have a lowest point (or a highest point, if the parabola is upside-down). This point, where the parabola changes direction, is called the "vertex".

f the quadratic is written in the form y = a(x –h)2 + k, then the vertex is the point (hk). This makes sense, if you think about it. The squared part is always positive (for a right-side-up parabola), unless it's zero. So you'll always have that fixed value k, and then you'll always be adding something to it to make y bigger, unless of course the squared part is zero. So the smallest y can possibly be is y = k, and this smallest value will happen when the squared part, x – h, equals zero. And the squared part is zero when x – h = 0, or when x = h. The same reasoning works, with k being the largest value and the squared part always subtracting from it, for upside-down parabolas.

(Note: The "a" in the vertex form "y = a(x – h)2 + k" of the quadratic is the same as the "a" in the common form of the quadratic equation, "y = ax2 + bx + c".)

Since the vertex is a useful point, and since you can "read off" the coordinates for the vertex from the vertex form of the quadratic, you can see where the vertex form of the quadratic can be helpful, especially if the vertex isn't one of your T-chart values. However, quadratics are not usually written in vertex form. You can complete the square to convert ax2 + bx + c to vertex form, but, for finding the vertex, it's simpler to just use a formula(The vertex formula is derived from the completing-the-square process, just as is the Quadratic Formula. In each case, memorization is probably simpler than completing the square.)

For a given quadratic y = ax2 + bx + c, the vertex (hk) is found by computing h = b/2a, and then evaluating y at h to find k. If you've already learned the Quadratic Formula, you may find it easy to memorize the formula for k, since it is related to both the formula for h and the discriminant in the Quadratic Formula: k = (4ac – b2) / 4a.


  • Find the vertex of y = 3x2 + x – 2 and graph the parabola.
    To find the vertex, I look at the coefficients ab, and c. The formula for the vertex gives me:
      h = b/2a = –(1)/2(3) = –1/6
    Then I can find k by evaluating y at h = –1/6:
      k = 3( –1/)2 + ( –1/) – 2
        3/36   –  1/6  – 2
        =  1/12   –  2/12  –  24/12
        =  –25/12
    So now I know that the vertex is at ( –1/6 , –25/12 ). Using the formula was helpful, because this point is not one that I was likely to get on my T-chart.


    I need additional points for my graph:

      
    T-chart: (-2,8), (-1,0), (0,-2), (1,2), (2,12)


      Now I can do my graph, and I will label the vertex:
        graph of y = 3x^2 + x - 2, with vertex marked and labelled
      When you write down the vertex in your homework, write down the exact coordinates: "–1/6 , –25/12 )". But for graphing purposes, the decimal approximation of "(–0.2, –2.1)" may be more helpful, since it's easier to locate on the axes.
      The only other consideration regarding the vertex is the "axis of symmetry". If you look at a parabola, you'll notice that you could draw a vertical line right up through the middle which would split the parabola into two mirrored halves. This vertical line, right through the vertex, is called the axis of symmetry. If you're asked for the axis, write down the line "x = h", where h is just the x-coordinate of the vertex. So in the example above, then the axis would be the vertical line x = h = –1/6.
      Helpful note: If your quadratic's x-intercepts happen to be nice neat numbers (so they're relatively easy to work with), a shortcut for finding the axis of symmetry is to note that this vertical line is always exactly between the two x-intercepts. So you can just average the two intercepts to get the location of the axis of symmetry and the x-coordinate of the vertex. However, if you have messy x-intercepts (as in the example above) or if the quadratic doesn't actually cross the x-axis (as you'll see on the next page), then you'll need to use the formula to find the vertex.

How to Find the Vertex of a Quadratic Equation


How to Find the Vertex of a Quadratic Equation


The vertex of a quadratic equation or parabola is the highest or lowest point of that equation. It lies on the plane of symmetry of the entire parabola as well; whatever lies on the left of the parabola is a complete mirror image of whatever is on the right. If you want to find the vertex of a quadratic equation, you can either use the vertex formula, or complete the square.

1st Method: Using the Vertex Formula

Find the Vertex of a Quadratic Equation Step 1.jpg

1
Identify the values of a, b, and c. In a quadratic equation, the x2 term = a, the x term = b, and the constant term (the term without a variable) = c. Let's say you're working with the following equation: y = x2 + 9x + 18. In this example, a = 1, b = 9, and c = 18.

Find the Vertex of a Quadratic Equation Step 2.jpg

2
Use the vertex formula for finding the x-value of the vertex. The vertex is also the equation's axis of symmetry. The formula for finding the x-value of the vertex of a quadratic equation is x = -b/2a. Plug in the relevant values to find xSubstitute the values for a and b. Show your work:
  • x=-b/2a
  • x=-(9)/(2)(1)
  • x=-9/2
Find the Vertex of a Quadratic Equation Step 3.jpg

3
Plug the x-value into the original equation to get the y-value. Now that you know the x-value, just plug it in to the original formula for the y value. You can think of the formula for finding the vertex of a quadratic function as being (x, y) = [(-b/2a), f(-b/2a)]. This just means that to get the y value, you have to find the x value based on the formula and then plug it back into the equation. Here's how you do it:
  • y = x2 + 9x + 18
  • y = (-9/2)2 + 9(-9/2) +18
  • y = 81/4 -81/2 + 18
  • y = 81/4 -162/4 + 72/4
  • y = (81 - 162 + 72)/4
  • y = -9/4
Find the Vertex of a Quadratic Equation Step 4.jpg

4
Write down the x and y values as an ordered pair. Now that you know that x = -9/2, and y = -9/4, just write them down as an ordered pair: (-9/2, -9/4). The vertex of this quadratic equation is (-9/2, -9/4). If you were to draw this parabola on a graph, this point would be the minimum of the parabola, because the x2 term is positive.

2nd Method: Completing the Square
Find the Vertex of a Quadratic Equation Step 5.jpg

1
Write down the equation. Completing the square is another way to find the vertex of a quadratic equation. For this method, when you get to the end, you'll be able to find your x and y coordinates right away, instead of plugging the x coordinate back in to the original equation. Let's say you're working with the following quadratic equation: x2 + 4x + 1 = 0.

Find the Vertex of a Quadratic Equation Step 6.jpg


2
Divide each term by the coefficient of the x2 term. In this case, the coefficient of the x2 term is 1, so you can skip this step. Dividing each term by 1 would not change anything.

Find the Vertex of a Quadratic Equation Step 7.jpg


3
Move the constant term to the right side of the equation. The constant term is the term without a coefficient. In this case, it is "1." Move 1 to the other side of the equation by subtracting 1 from both sides. Here's how you do it:
  • x2 + 4x + 1 = 0
  • x2 + 4x + 1 -1 = 0 - 1
  • x2 + 4x = - 1
Find the Vertex of a Quadratic Equation Step 8.jpg

4
Complete the square on the left side of the equation. To do this, simply find(b/2)2 and add the result to both sides of the equation. Plug in "4" for b, since "4x" is the b-term of this equation.
  • (4/2)2 = 22 = 4. Now, add 4 to both sides of the equation to get the following:
    • x2 + 4x + 4 = -1 + 4
    • x2 + 4x + 4 = 3
Find the Vertex of a Quadratic Equation Step 9.jpg

5
Factor the left side of the equation. Now you will see that x2 + 4x + 4 is a perfect square. It can be rewritten as (x + 2)2 = 3

Find the Vertex of a Quadratic Equation Step 10.jpg

6
Use this format to find the x and y coordinates. You can find your x coordinate by simply setting (x + 2)2 equal to zero. So when (x + 2)2 = 0, what would x have to be? The variable x would have to be -2 to balance out the +2, so your x coordinate is -2. Your y-coordinate is simply the constant term on the other side of the equation. So, y = 3. You can also do a shortcut and just take the opposite sign of the number in parentheses to get the x-coordinate. So the vertex of the equation x2 + 4x + 1 = (-2, -3)

Graphing Parabolas


Graphing Parabolas

Graph the parabola y = x2 - 4on the interval [-1,5].
                             (Remember:  [-1,5] means from  = -1  to  x = 5 inclusive.)
Prepare a chart:
xx2 - 4xy
-1(-1)2 - 4(-1)5
0(0)2 - 4(0)0
1(1)2 - 4(1)-3
2(2)2 - 4(2)-4
3(3)2 - 4(3)-3
4(4)2 - 4(4)0
5(5)2 - 4(5)5
Plot the points generated in the chart.  Draw a smooth curve through the points.
The points where the graph crosses the
x-axis are called the roots of
0 = x2 - 4x.
This parabola crosses the x-axis
at (0,0) and (4,0).
 
In this example, the interval used for preparing the chart was given in the question.  Consequently, the turning point of the parabola fell within the interval.  If the question had NOT told us the interval, how would we have known which values to place in the chart to ensure that we would see the turning point of the parabola?  To guarantee that the points you choose for your chart will show the turning point, start by determining the axis of symmetry of the parabola. 

The 
axis of symmetry is a vertical line passing through the turning point of a parabola.
In our first example, the turning point was (2,-4).  The equation of the axis of symmetry is the equation of the vertical line passing through (2,-4), or in this case x = 2.

Parabolas are of the quadratic form:  y = ax2 + bx + c
If a is positive, the parabola opens upward and has a minimum point.
The axis of symmetry is
 x = (-b)/2a
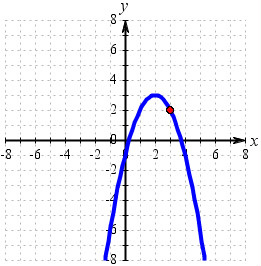
If a is negative, the parabola opens downward and has a maximum point.
The axis of symmetry is
 x = (-b)/2a.

Example 2:
                       Graph the parabola y = x2 + 6x - 1  (no interval specified)
Rather than picking numbers at random to form our chart of values, let's first find the axis of symmetry.  This will guarantee that our chart will graph the turning point of the parabola and give us a good graph.
To find the axis of symmetry, use the formula   x = -b/2a
In this example, a = 1 and b = 6.
Substituting gives:  x = -(6)/2(1) = -6/2 = -3
 Axis of symmetry:   x = -3
Since the x-coordinate of the turning point is -3, use this value as the middle value for x in the chart.  Include 3 values above and below -3 in the chart.
Substitute each value of x into the quadratic equation (the parabola), to find the corresponding values for and complete the table.  When the table is complete, plot the points and draw the graph.
 

x
y
-6
-5
-4
-3-2
-1
0

Set up the table.
x
y
-6
-5
-4
-3-2
-1
0
-1
-6
-9
-10
-9
-6
-1
Complete the table.

Parabolas in real life

THERE ARE EVEN PARABOLAS IN REAL LIFE, AND THESE ARE SOME OF IT


In tourist spots


In nature


In Amusement Parks


In Sports


In some fast food chains


And many more...

And there are even parabolas in games too, and these are some of the examples...